
Katarzyna Pawlak
•Feb 22, 2026
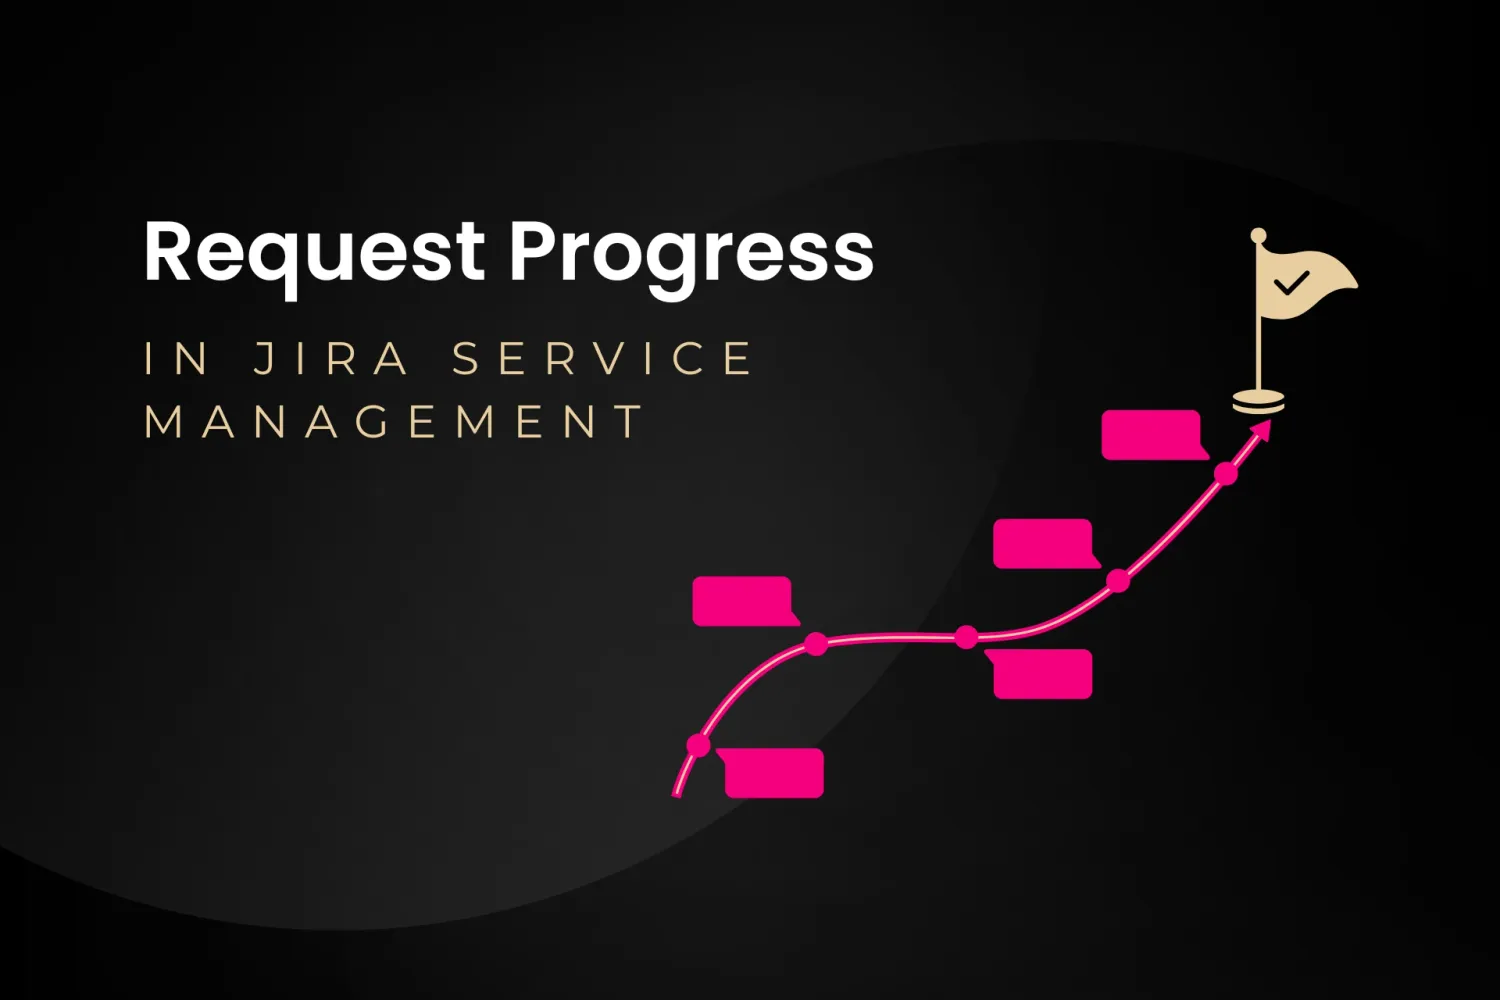
Read how to display workflow on the Customer Portal and visualize request progress in JSM. Transform static workflow statuses into a clear ticket lifecycle to boost customer trust and reduce support volume.

Track service performance & build custom ITSM reports for agent’s efficiency in Jira
Surface unique service desk data that links support activity to business outcomes, guiding your strategic planning.
Analyze clear charts and diagrams directly within your native Jira Dashboards. No extra configuration or complex tools are required.
Use direct agent scoring metrics to improve customer support. Data-driven insights lead to better team results and higher CSAT scores.
Access deeper insights on team and service performance, even when managing support across dozens of Jira Service Management projects.
Achieve time efficiency with metrics that are already analyzed and ready-to-present. Skip the manual work and deliver ITSM Reports instantly.
Identify and remove workflow issues and pain points in your service process. Use compliance data to improve process efficiency across the board.
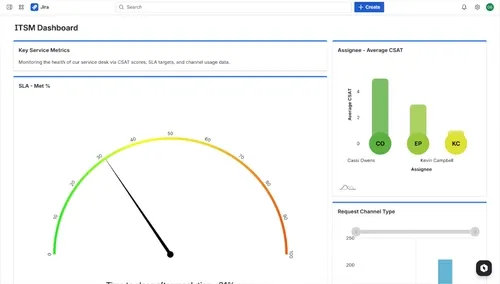
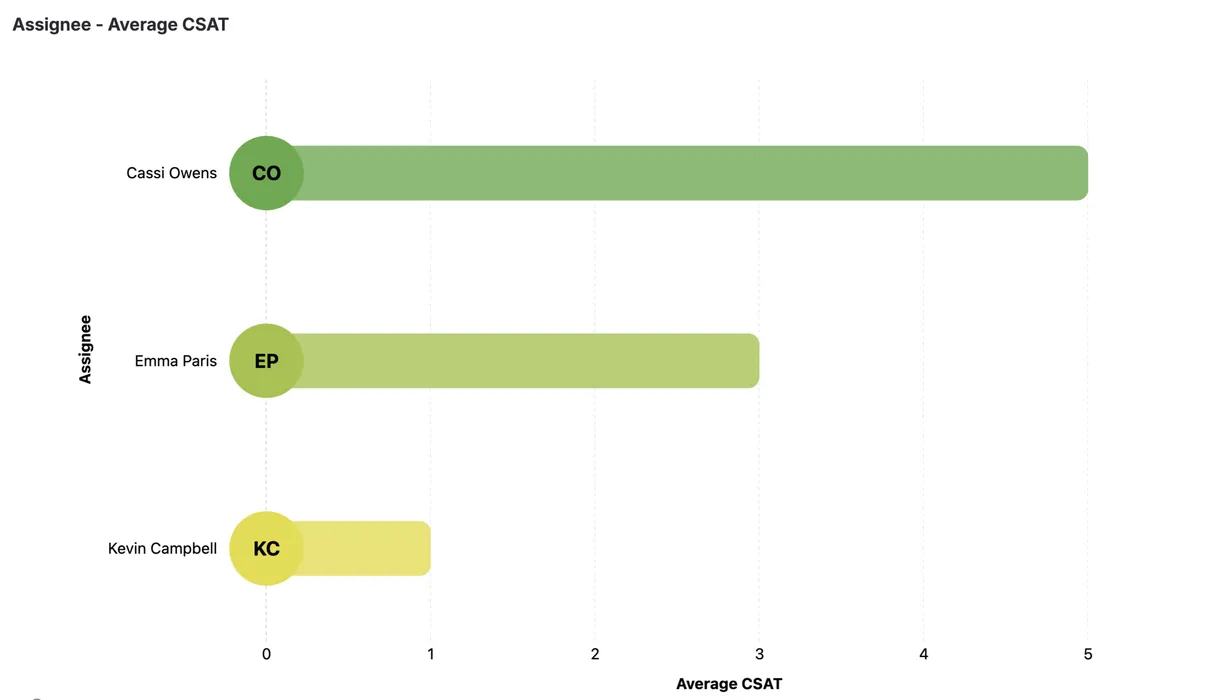
Assignee - Average CSAT Report
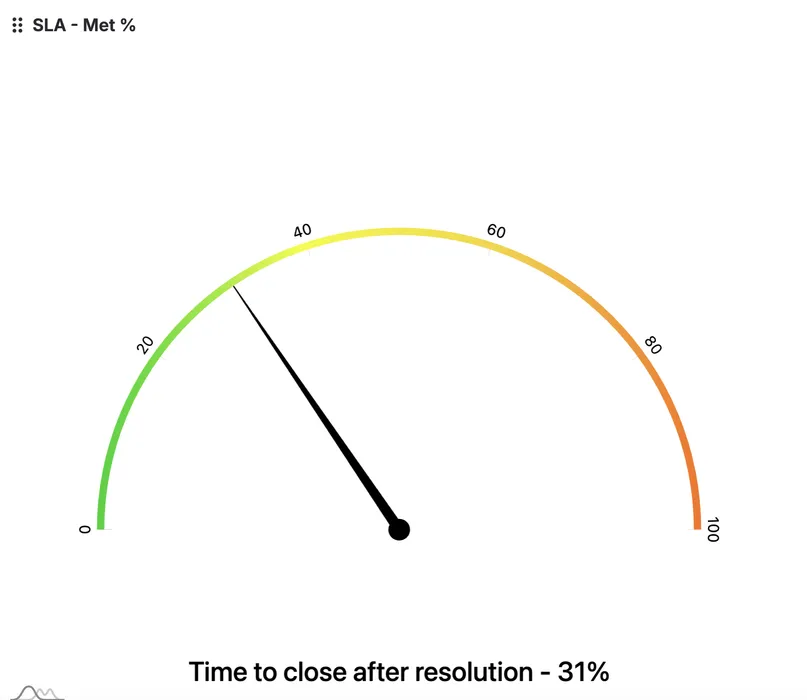
SLA - % Met Report
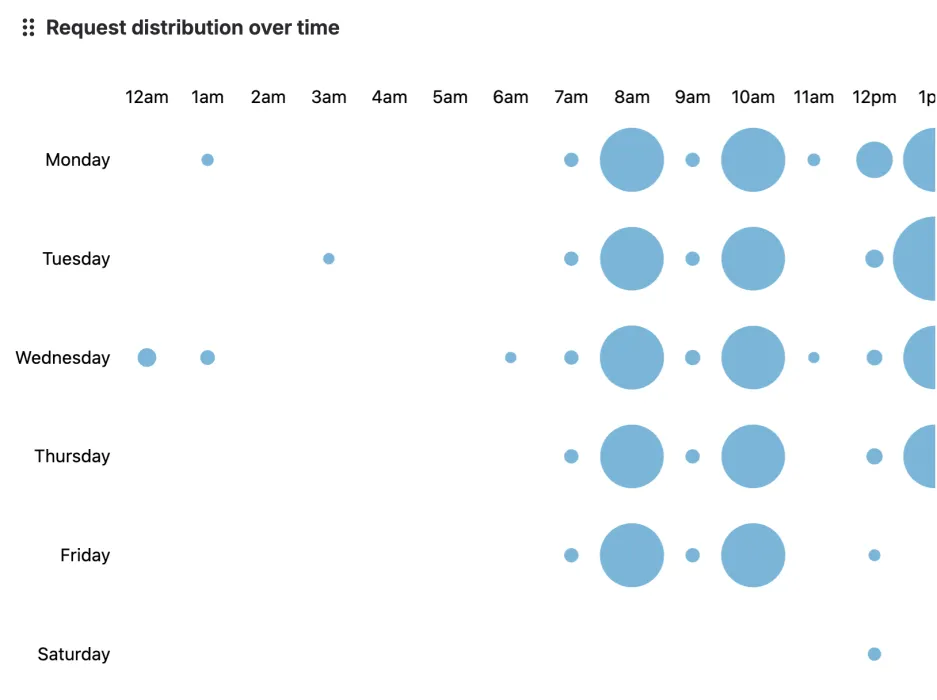
Request Distribution Report
Request Channel Type Report
Organization Size Report
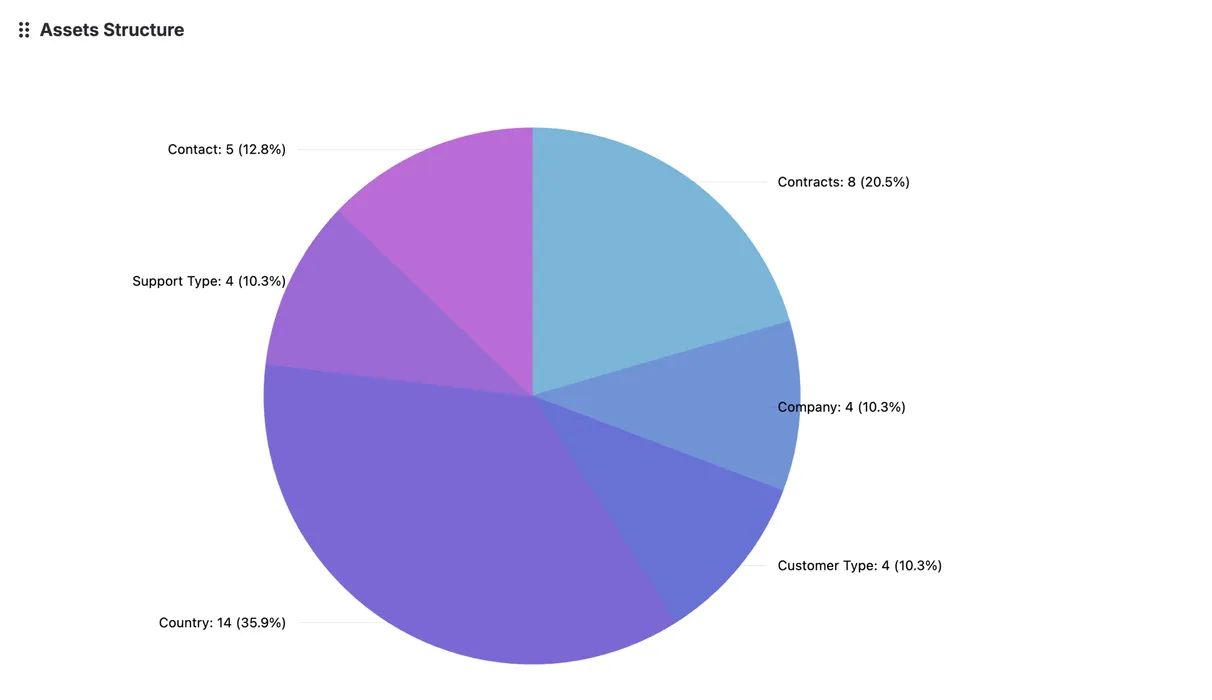
Assets Structure Report
Support
Customer Support
Gluon is a powerful app for Jira Service Management designed for large organizations. Coming before Team26.
Get quick answers on how to measure and master your JSM service performance
Katarzyna Pawlak
•Feb 22, 2026
Read how to display workflow on the Customer Portal and visualize request progress in JSM. Transform static workflow statuses into a clear ticket lifecycle to boost customer trust and reduce support volume.

Katarzyna Pawlak
•Jan 14, 2026
Discover the best apps for Jira Service Management in 2026 to improve customer portals, streamline ITSM workflows, and boost agent productivity

Katarzyna Pawlak
•Sep 12, 2025
Read our guide on The Unified Workflow Playbook: 5-Team Guide to HubSpot & Jira on the Appsvio blog.
Appsvio apps streamline Jira Service Management and testing processes for global teams. Recognized as Atlassian’s Partner of the Year in ITSM App Solutions for 2023 and nominated in High Velocity Service Management Apps in 2025.


Copyright 2026 Appsvio. All Rights Reserved. This website does not use cookies.