Show SLA metrics to customers
The SLA Metrics field shows the SLA timers of a request, such as the time to first response or the time to resolution, on the customer portal. Customers see the deadline and how much time is left.
Before you start
- You are both an administrator of the service space and a service desk agent in it.
- You have a panel. See Create a panel.
Advanced edition
The SLA Metrics field is available only in the Advanced edition. On Standard, it is marked ADVANCED PLAN and you can’t add it. See App Editions.
Steps
Go to Space settings > Apps > Feature Bundle > Additional Fields and open the panel.
Open the Design tab, select Select object to add, and then select Field.
In the Select field type dialog, select SLA Metrics (in the Other group) and select Add field.
Expand the card of the field. In SLA Metrics, select the metrics you want to show. Leave the field empty to show every metric that has data on the request.
The list contains the SLA metrics of the space. Jira reads them from an existing request, so a space without any request that has an SLA shows an empty list.
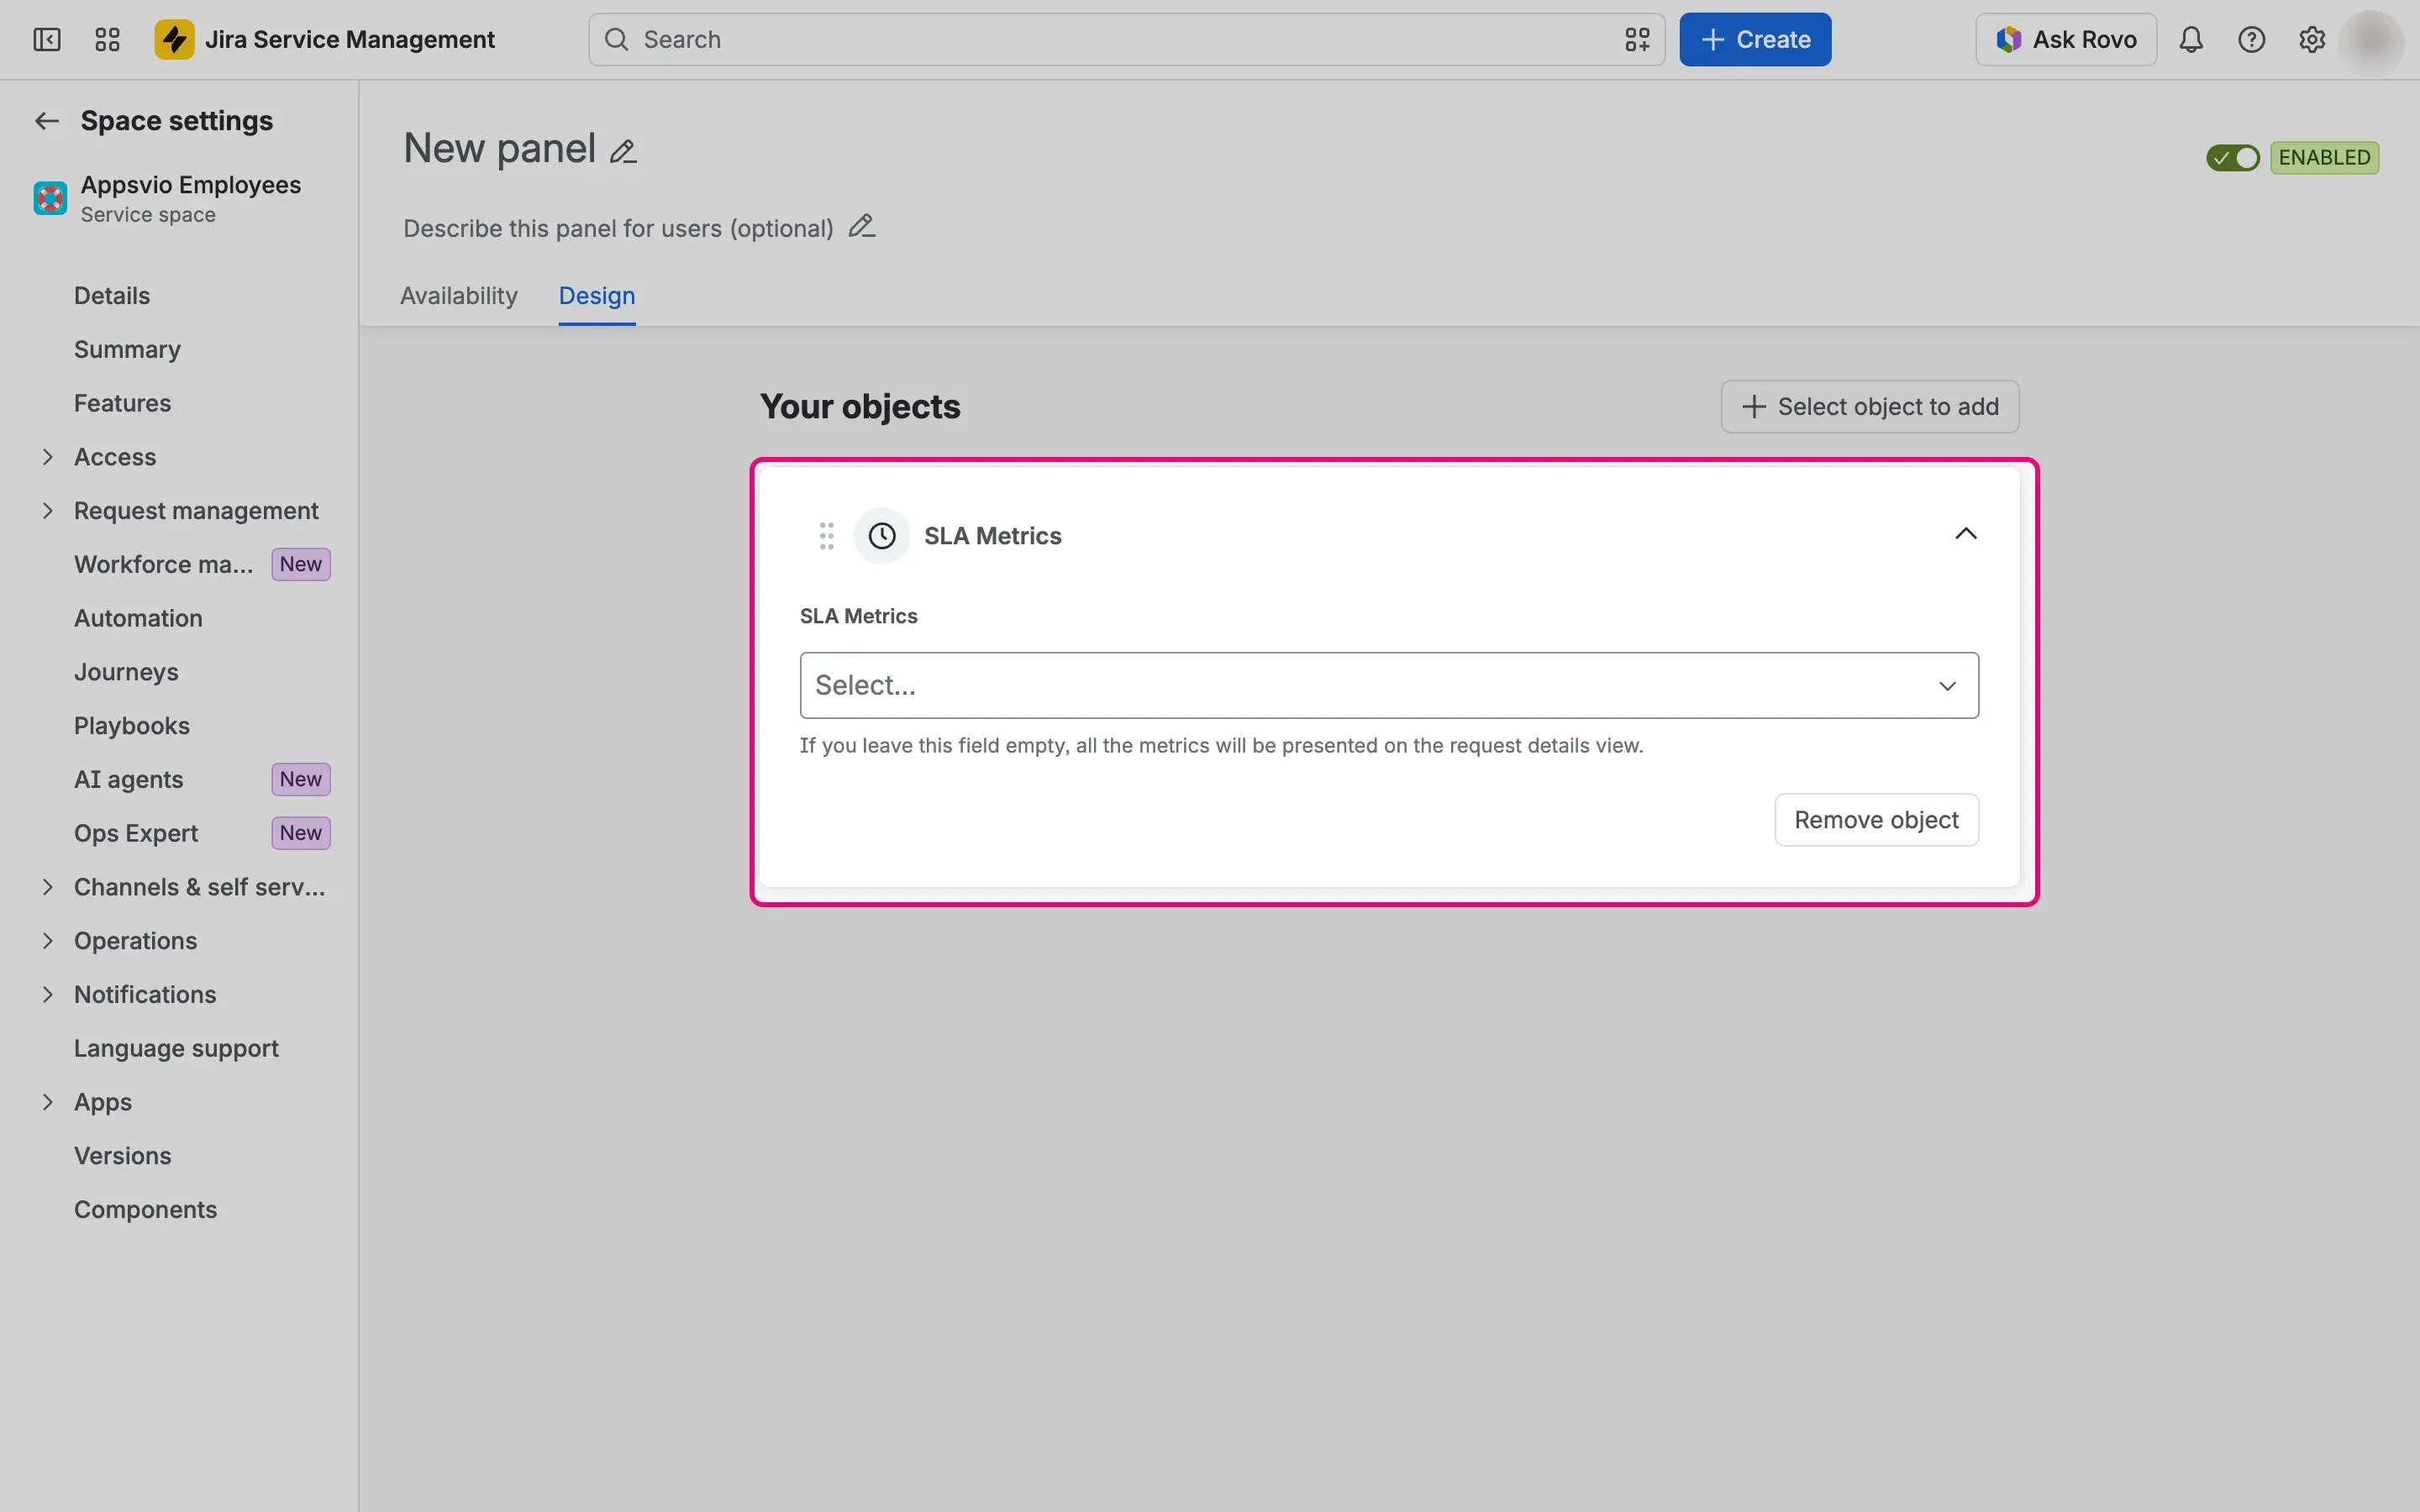
Select Save.

Placement
Put the panel in the Top zone to show the deadlines above the request summary.
Result
On a matching request, the panel shows an SLA Metrics section with a card for each metric. A card shows:
- the date and time of the deadline;
- the time remaining, in hours and minutes;
- a description in the form “SLA name within goal”, for example “Time to resolution within 4h”;
- a status that follows from the SLA configuration in Jira: AT RISK, Paused, MET, or BREACHED.
A metric that has nothing to show is hidden, and the field has no option to show it when empty.
