
How to Display Custom Columns (SLAs & Assets) in Jira Customer Portal
Standard JSM portals hide critical asset details and SLA timers from your users. How does this visibility gap slow down your support, and how can you fix it? Discover a smart way to bridge that gap.


Standard Jira Customer Portal requests tables do not display critical request metrics to end-users. This lack of transparency is the primary trigger for client frustration, driving users to crowd your support queue with redundant follow-up tickets just to ask: How much longer do I have to wait?. Upgrading your Jira Service Desk (Jira Service Management) layout with live data is the most direct way to eliminate these communication bottlenecks, improve the customer experience, and reduce your team’s support workload.
You can easily resolve this limitation with UniPortal.
Meet UniPortal
UniPortal upgrades the standard customer portal table by unlocking custom columns like Assets and SLAs. Whether you operate a single JSM instance or look to merge multiple Jira service desks, your customers get a unified, data-rich view without complex custom coding.
- This Use Case: No-code customization of the customer request list view.
- Key Benefit: Complete visibility that cuts down on “status update” follow-up tickets.
See other ways to use the app:
Key Takeaways
- The Native JSM Visibility Limit: Standard Jira Customer Portal dashboards restrict end-users from tracking internal fields, such as live countdowns for your Jira Service Desk SLA or linked hardware and software assets.
- The Code-Free Alternative: Instead of dedicating developer hours to writing custom scripts with the Jira Assets API or managing complex Jira automation custom fields, administrators can use a no-code Jira SLA plugin to instantly adjust portal layouts.
- Enhanced Customer Transparency: Upgrading your ‘My Requests’ table with real-time service desk SLA metrics reduces redundant “status update” inquiries, optimizing the digital customer experience.
The Native Visibility Problem in Jira Service Desk: Top 3 Realities of SLA Tracking
To understand the root cause of customer frustration, you must look at the data visibility gap between support agents and end-users. In a default configuration, tracking an active Jira Service Desk SLA breaks down into three distinct realities:
1. The Agent’s View (Backend & Queues)
Inside the Jira backend, support agents have full visibility. They track real-time countdowns like Time to resolution or Time to first response directly on the issue screen. These metrics populate their queues, allowing agents to prioritize daily workloads and meet contractual obligations.
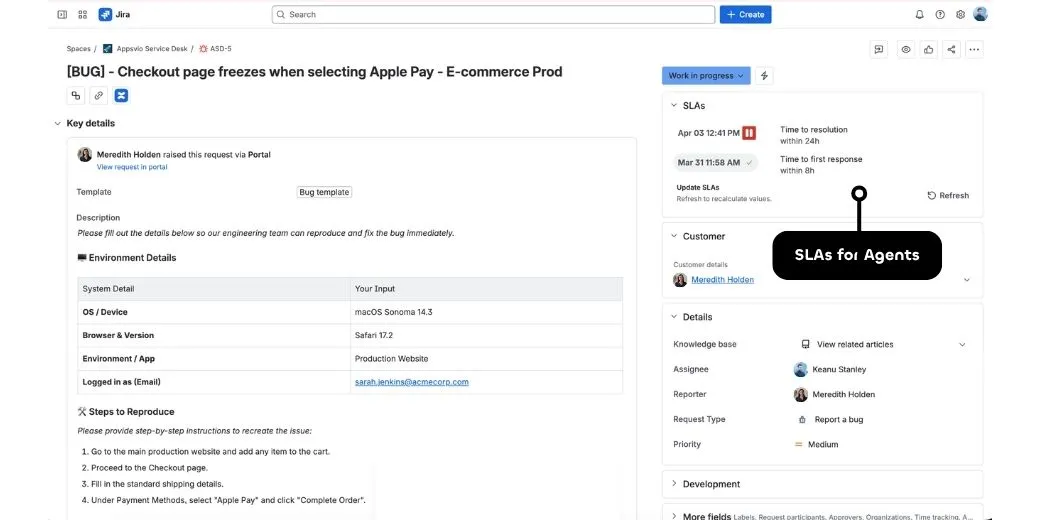
SLAs for Agents.
2. The Customer’s Request View (Single Ticket Screen)
When a customer clicks into a specific request to check its progress, they face severe layout restrictions. By default, Atlassian limits their visibility to a static Status: In Progress, providing no indication of whether the ticket will be resolved in five minutes or five days.
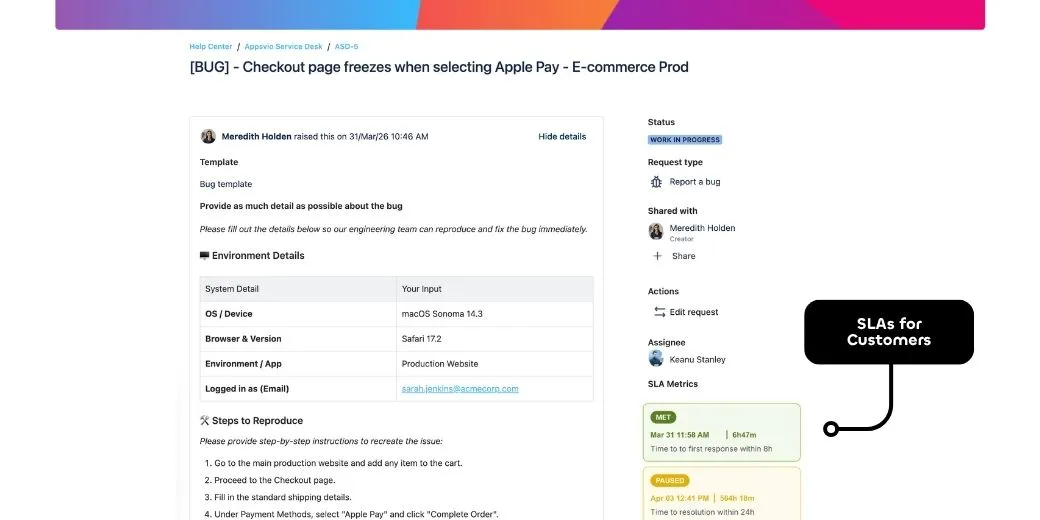
SLAs for Customers.
The Single-Ticket Workaround:
If you need to unhide an active SLA in Jira on this individual request screen, you can use the Additional Fields feature within our Feature Bundle extension. While it establishes single-ticket clarity, it does not solve the issue when customers need an overview of all their active tickets.
3. The Customer’s ‘My Requests’ Table View (The Ultimate Blind Spot)
This is where the native Jira Customer Portal layout setup falls short for advanced service desks. When users navigate to their main request list, adding columns for live SLA metrics or specific asset components is not supported out of the box.
The Marketplace Advantage:
On Atlassian’s public roadmap tracker, feature request JSDCLOUD-4580 highlights the community’s long-standing demand for portal column customization. While Atlassian addressed this by introducing support for several core native fields, the platform is structured to leave specialized use cases, like real-time SLA metrics or asset tracking, to ecosystem partners.
Because these advanced fields cannot be added via native configurations, users must click into individual tickets to find specific timelines. We developed UniPortal specifically to clear this hurdle. It builds directly on top of Atlassian’s foundations, allowing administrators to extend the standard layout and inject dynamic counters into the main overview table.
Why is the Jira Assets API Not Enough for Support Leaders?
Managing hardware, software licenses, or IT infrastructure components requires context, not just for support agents, but for end-users as well. While Jira naturally displays linked asset parameters within an individual ticket view, it cannot render them as a column in the main ‘My Requests’ table. The platform simply lacks a native layout option to expose asset custom fields on the overview list.
To clear this hurdle, Jira Service Management administrators often resort to complex, manual workarounds. For example they write custom scripts to pull data directly via the Jira Assets API. Unfortunately, this approach is highly inefficient, difficult to scale, and prone to breaking during Atlassian cloud updates.
Furthermore, configuring these elements as Jira required fields does not solve the core issue, as the native ‘My Requests’ view lacks the framework to render asset object details inside a unified data table. Support leaders need a stable, no-code way to inject asset custom fields visibility directly into the customer’s primary list view.
Extending the Portal Layout with UniPortal: The Secure, No-Code Alternative
Many support leaders transitioning from Jira Data Center to Jira Cloud face a distinct technical challenge. In the Data Center, administrators could inject custom JavaScript to modify the native request table. In the Cloud environment, however, Atlassian’s secure framework completely prevents this type of frontend manipulation.
To overcome this layout restriction, traditional marketplace extensions force administrators to deploy separate, external web pages hosted on third-party domains. This approach introduces compliance headaches, data residency concerns, and a fragmented user experience.
This technical bottleneck is why we developed UniPortal. Instead of taking users away from your secure ecosystem, UniPortal acts as a native Jira SLA plugin that integrates into your existing dashboard.
How UniPortal Transforms Your ‘My Requests’ View:
- Pure No-Code Architecture: Administrators can completely bypass complex development. Using an intuitive administration panel, you can inject highly requested fields like Atlassian SLA countdowns and asset alignments into the main portal view in minutes.
- Zero Data Leakage: Because the app builds directly on native foundations, all your data remains securely within your Atlassian instance. There are no external hosting dependencies or third-party data synchronization risks.
- Directly Embedded UI: Your clients do not need to learn a new interface or navigate to an unfamiliar URL. UniPortal renders as a clean, embedded dialog box directly within the native Jira Customer Portal menu.
Much like how popular tools like advanced tables for Confluence fix page readability without altering core Confluence infrastructure, UniPortal upgrades your request navigation while keeping your primary support portal intact. It bridges the gap between complex back-end operations and a clean, accessible customer interface.
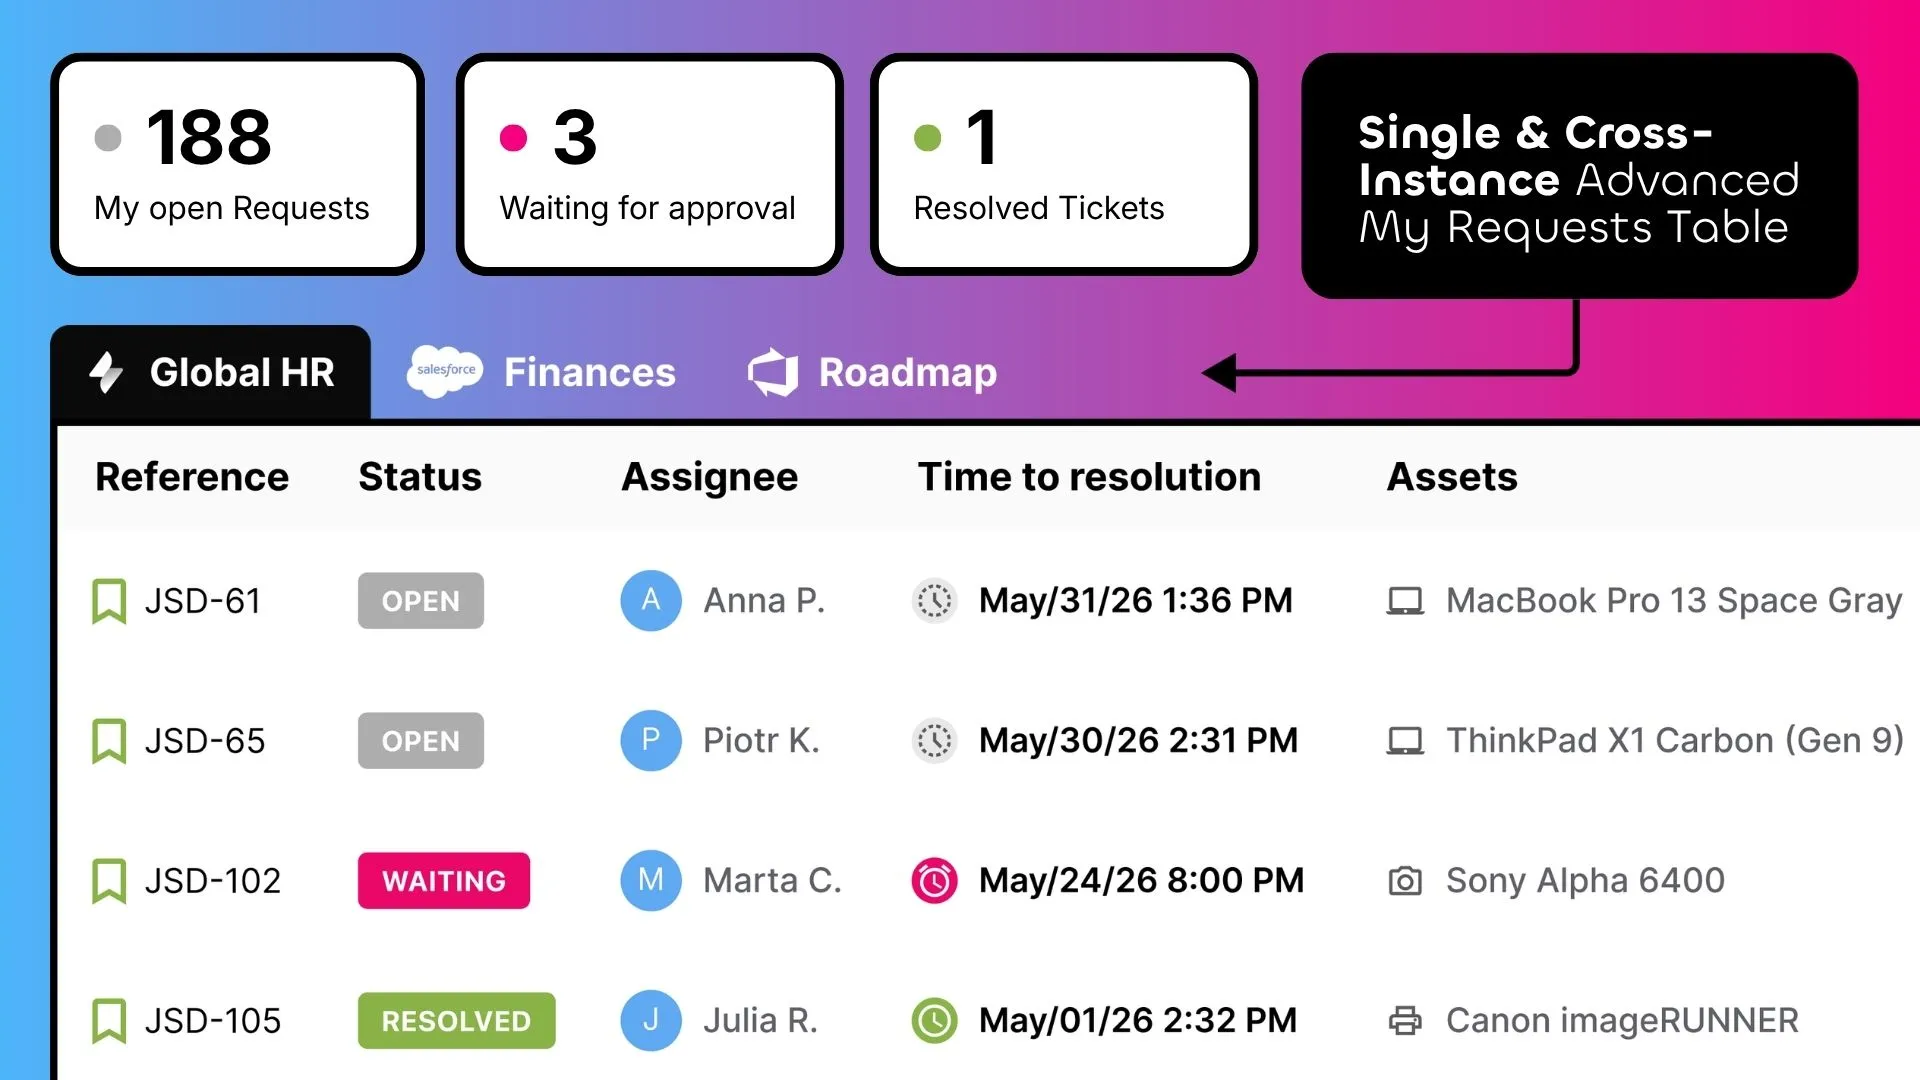
Advanced My Requests Table.
Using JQL Statistic Counters for Instant Navigation
An advanced data table is only as good as its navigation. If a customer or manager has dozens of active tickets, scrolling through rows to find a specific item defeats the purpose of an upgraded portal layout. This is why UniPortal goes beyond columns by introducing JQL statistic counters: up to three customizable metric blocks anchored at the very top of the screen.
- Born from Real Feedback: The idea for these counters came directly from management teams using Jira Service Management, who were tired of clicking into every single ticket just to see what was pending.
- Instant Overview: With these metric blocks, users get a high-level scan of exactly how many requests are waiting for their attention or support action.
Because these counters are powered entirely by flexible JQL queries, administrators can tailor them completely to their organization’s specific workflow:
- Filter Request Types: Configure blocks to filter across various Jira request types, such as active bugs, access requests, or hardware inquiries.
- Escalate Critical Tasks: Instantly drag a critical change request Jira ticket to the absolute top of the user’s view.
- Streamline Approvals: Display the exact number of tickets currently Waiting for my Approval, turning a cluttered request list into an actionable dashboard without needing an extra Jira search custom field.
The Business Impact: Moving from SLA to XLA
For years, IT departments evaluated support success solely through contractual timeframes. However, modern IT service delivery is undergoing a fundamental shift from rigid Service Level Agreements (SLAs) to Experience Level Agreements (XLAs). When comparing XLA vs SLA, the difference lies entirely in perspective:
- SLA measures technical, back-end performance (e.g., did we hit the response deadline?).
- XLA measures the actual quality of the digital customer journey and how valued the end-user feels during the process.
Relying strictly on native setups often highlights the friction in the SLA vs XLA dynamic. Consider standard Jira Service Desk SLA examples: an agent might resolve a critical server incident within the designated four-hour window, successfully meeting the SLA. However, if the customer spent those four hours blind to the progress, checking a static dashboard and opening secondary issues out of anxiety, their overall experience remains poor.
True customer satisfaction cannot be achieved in a data vacuum. Upgrading your customer portal with UniPortal allows you to transform cold metrics into transparency. Exposing live countdowns and asset alignments directly in the ‘My Requests’ table eliminates the uncertainty that triggers client frustration, shifting your support operations from a basic reactive help desk to an advanced, experience-driven organization.
Summary: A Smarter Way to Manage Customer Requests
UniPortal functions as an essential, no-code upgrade for any single-instance environment looking to break down native layout limits and build a transparent help desk. Pulling critical data like hardware assets, dynamic countdowns, and custom JQL metrics directly into a unified ‘My Requests’ table, you eliminate the visibility gaps that trigger customer anxiety and overflow your support queues.
Providing this level of clarity ensures your support delivery moves from simple ticket management to an advanced, experience-driven operation.
Ready to transform your support experience?
Try UniPortal for free today and see the difference it makes for your team.
Go to Atlassian MarketplaceFAQs
If you want to unhide an active SLA on an individual request screen (the single ticket view), you can use the Additional Fields feature within our Feature Bundle extension. However, to expose dynamic, real-time ticking service desk SLA metrics to external users in their main list overview (the 'My Requests' table), you need a dedicated portal customization tool like UniPortal to bypass these native frontend restrictions.
Related posts
Katarzyna Pawlak
•Sep 24, 2026
Dariusz Jaroń
•Aug 12, 2026